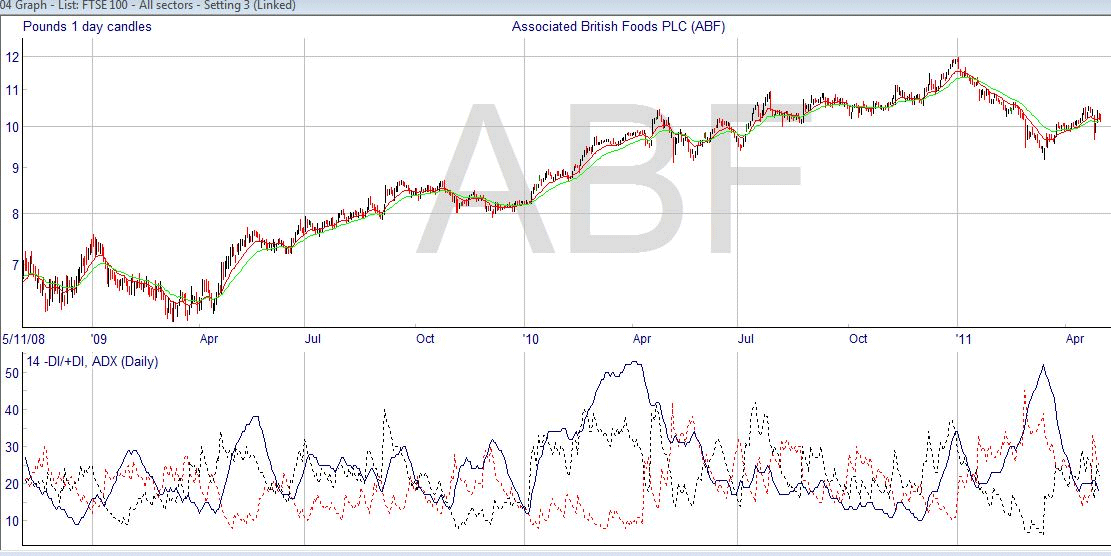
Directional movement is actually a set of lines. The directional movement indicator (ADX) gives a good idea of the strength of the prevailing trend, as well as whether there is movement at all in the security, so it can be used in a couple of ways. Firstly as a trend following system in and of itself, and secondly just to show that a trend exists so that other indicators can be used.
There are three parts to the directional movement indicator, and these are shown as three different lines on the chart.

The actual directional movement is calculated by seeing whether the greater part of the trading range on a day is above or below the trading range for the previous day – if it’s above, then the movement is positive, and if below then it is negative. The directional indicator (DI) is found by dividing the directional movement by the true range for the day. The actual average directional index, the ADX, which is shown as the solid line in the chart above is calculated by taking the difference between the positive and negative directional indicators and dividing by the sum of them.
Fortunately, all this work is done by your computer, but where does all this get you? Well, the higher the value of the ADX, the greater is the momentum of the price movement, whether it is up or down, and therefore the stronger the trend. It can take a little while to get your head around the somewhat confusing lines, but the important thing is not how they are calculated but how you can use them.
In basic terms, you’ll look first at the ADX line, and from this you can see if the share price is trending, shown by the line moving upwards. If you look at the +DI, the black dotted line, and the -DI, the red dotted line next, you can see the direction of the trend. When the +DI rises above the -DI, it is a bullish sign, and when the +DI falls below the -DI then the trend is bearish, or downwards.
Commonly used values for the ADX are that it must be above 30 to show a strong trend; some people take a value above 20 as long as it is rising, as any time it is falling it can be a sign that the trend is losing momentum. The distance between the +DI and the –DI lines is also an indication of the strength of the trend, as well as telling us the direction that we should expect. The ADX indicator is not used much, which is a pity as it can be very informative.