In profitability analysis we look at the strongest correlating factors to increased profitability. Earnings drive share prices so it will come as no surprise that profitability analysis is at the core of stock selection.
The relationship between growth and profitability
A company can look like a great investment from a growth point of view. But growth is only one side of the coin. The other side is reinvestment.
When looking for potential investments, we want to see:
1. Growth, and
2. Reinvestment of excess profits
The role of growth
Growth is critical. If we want to make money in stocks, we need growth.
Growth can come from a number of sources. Some common examples include:
- Increases in revenues
This could be from selling more products or services. Or, increasing the prices of those products or services - The introduction of new products or services
- Acquisitions (i.e. buying another company) is another way of growing
The best growth is sustainable. The key question is:
“Will the growth continue?”
We won’t be able to ascertain this for sure, but we can move closer to the answer by finding out where the growth came from. A company’s annual, half-yearly, or quarterly report should be able to tell you what the story is.
It’s easy to understand that increasing revenues by selling more goods or services is great way to grow.
Increasing prices can only extend so far. Prices can only be raised so high (not all companies are in a position to increase prices without losing market share in any case).
New products or services might also be good if they turn out to be popular.
As for acquisitions, they rarely deliver value. Companies usually end up paying far too much for the companies they acquire. And then there is the job of integrating the new company with the existing one. This puts a further drain on finances.
Reinvestment
The reinvestment of excess profits comes has two components:
1. Free cash flow, and
2. Return on capital (ROC)
Free cash flow
Cash flow from operations tells us how much cash a company generates. Some professional investors consider cash flow to be the true measure of a company’s profits. Whether this is true or not, cash flow does have a strong correlation to share price performance.
An even better measure of cash flow is free cash flow. Free cash flow represents the money that’s left over after a company has allowed for capital expenditure costs.
Free Cash Flow = Cash Flow from Operations – Capital Expenditure
How management decides to use the free cash flow is important.It can be used to:
- Pay down debt
- Buy back shares
- Pay higher dividends
- Reinvest in the higher margin (i.e. more profitable) business lines
The key point is that free cash flow can be used to drive value. Free cash flow quite often leads to higher share prices.
Return on Capital
Instead of just looking at a profit figure in isolation, it makes more sense to consider profit in relation to the capital that generated it.
Return on capital (ROC) tells us what sort of return the company has been able to achieve on the capital invested in the business.
ROC is an excellent profitability metric. It improves on return on equity (ROE) by including debt in the denominator.
There are more sophisticated versions of ROC but for the purposes of our discussion, we’ll use:
ROC = EBIT / (Shareholders’ equity + long-term debt)
What we’re looking for is a ROC that has consistently been above 10% or so. A company that consistently reinvests capital at higher rates of return is a good business (one worth owning).
Applying the theory – let’s look at some numbers
What I have just presented is a very sweet scenario. A company that generates more money than it needs – free cash flow. And then reinvests that excess cash for a high rate of return – return on capital. Combine that with strong growth and an industry with lots of potential, and you could be onto a winner.
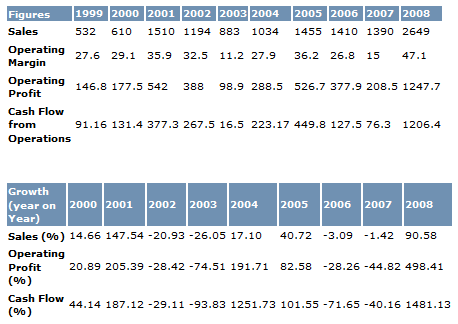
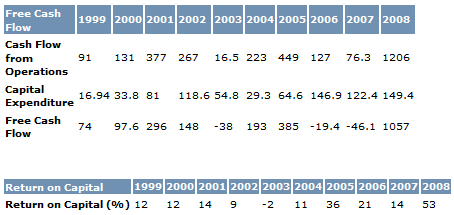
Here are some key numbers for the Australian resources company Coal & Allied Industries Limited.
Growth
We’re looking for consistency. But because we know this is a resources company in a cyclical industry, we’ll be a little bit lenient. Unlike some other types of investments, cyclicals are all about getting in at the right time. And getting out when the industry appears to be reaching its peak.
From the figures above, we can conclude that growth over the ten year period has been good for sales, operating profits, and cash flow. Margins have remained fairly consistent over that time given the nature of the business. So overall, the growth is good.
Profitability
It’s apparent that this company generates consistent free cash flow. It has also managed to keep its return on capital consistently above ten percent (our cut-off benchmark).
The ten percent ROC requirement is really a rough rule of thumb. It is meant to prevent you from investing in underperformers. If a company can’t generate a return on capital substantially greater than its cost of capital, then real returns aren’t being achieved.
Some professional investors take an extra step. They calculate the cost of capital and then subtract it from the return on capital. If the difference between the ROC and the cost of capital isn’t great enough, they won’t invest in the company.
How fundamentals drive stock prices
What I’d like to do now is look at some growth and profitability data alongside the company’s stock chart. That way we can try to determine what drives earnings (and hence stock prices) for a particular company.
I deliberately chose a cyclical company for this example because it displays a strong correlation between the fundamentals and the actual stock price movement. Not all companies will display such a strong correlation. With cyclical companies, their profitability moves with their industry cycle. They illustrate the effects that growth and profitability have on a share price very nicely.
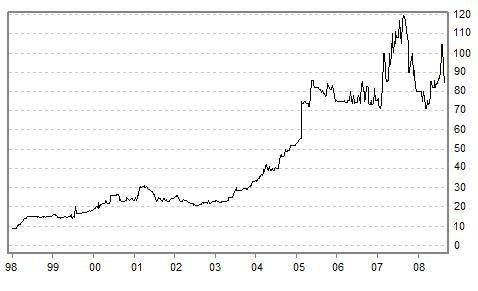
Coal & Allied Industries Limited
Here we can see the stock moving sideways from 1998 through to approximately 2004. From 2004 to 2005 it moved up very nicely before consolidating (i.e. moving sideways) until 2007. After which it made another gain.
By looking at the fundamentals (in the previous tables) we can see some patterns.
What happened in the year prior to the big rises in stock price?
Let’s start with 2003 to 2004. Sales growth at the end of 2004 came in at 17%. With the operating margin close to 28% at that time, it’s easy to see that the 17% sales growth would have a favorable impact on profits (sales x operating margin = operating profit).
Operating profit grew 191% in the same period. That’s very substantial.
And cash flow growth came in at 1251%.
It’s always nice to see sales, cash flow, and operating profits moving upwards together.
Buying the stock after the 2004 results were released would have yielded a nice return.
Summary Points
- Substantial growth in sales, cash flow and earnings is required
- Companies need to be profitable from both a free cash flow and a return on capital perspective. The reinvestment of excess profits drives value.
- Fundamentals drive stock prices in the medium to long term
- Continue on to Lesson 7: Financial Health


